The Executive dashboard
PERMISSIONS Autotask users with access to the Admin, Contracts, and Reports modules.
Access to specific data may be restricted by your Autotask security level. For example, you must also have Service Desk access in order to view ticket details from the Service Desk Summary, unless the ticket is assigned to you.
NAVIGATION Left Navigation Menu > Home > View > Executive Dashboard.
TIP You can set this dashboard as your home page in your user profile. Refer to Settings.
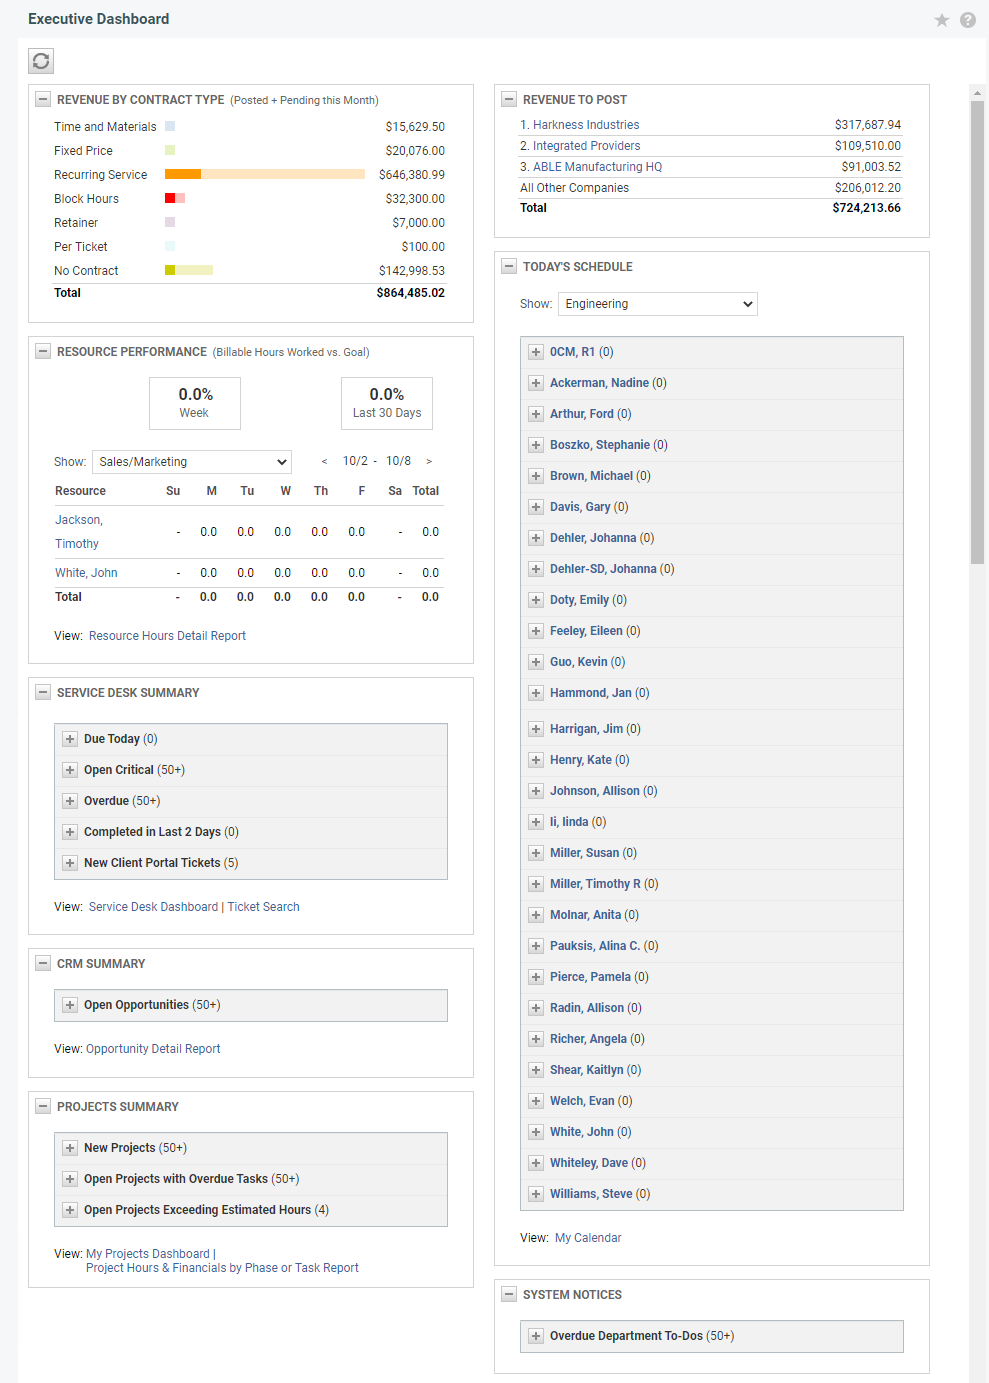
The Executive Dashboard displays a summary view of important information about current business activity tracked in Autotask. The dashboard includes tables, lists, and graphs that provide an instant visual overview of the following eight areas of interest for daily operation.
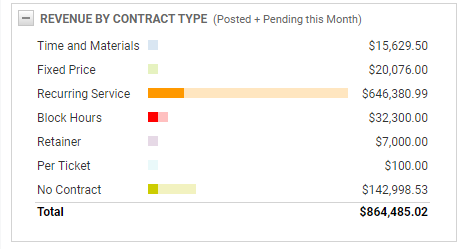
This graph provides a quick visual analysis of pending and posted revenue for the current calendar month for each of the Autotask contract types, as well as for no contract (revenue not tied to a contract).
Each bar represents an Autotask contract type with one bar for No Contract. The number to the right of each bar is the total of all posted and all pending revenue for the current month for that contract type. The last line displays the total of all pending and posted revenue.
The two shades of each bar's color represent Posted and Pending revenue.
- Posted Revenue, the darker color, includes all revenue with a posted date in the current calendar month.
- Pending revenue, the lighter color, includes all unposted revenue that is pending through the end of the current month, including pending revenue carried over from previous months.
TIP Hover over the darker or lighter shade of each bar to display the posted or pending amount.
TIP For a list of billable items used to calculate the revenue totals in this dashboard, refer to Definitions and Calculations.
Two Executive Reports for the Revenue by Contract Type figures are available in the Financial Reports section of Executive Reports page (click Left Navigation Menu > Home > Executive Reports).
| Category | Report | Description |
|---|---|---|
| Profitability (Organization, Contract, Project) | LiveReports > Profitability – Posted Revenue by Contract Type – Executive Dashboard | A detailed line item view of revenue, cost, and profit for the selected organizations, grouped by contract. Data may be filtered by item date, posted date, billing code name, parent organization name, contract name, and contract type. |
| Waiting Approve and Post | LiveReports > Waiting Approve and Post – Pending Revenue by Contract Type – Executive Dashboard | Information on items in the system waiting to be posted. This includes task and ticket work, project and ticket charges, milestones, expenses, and subscriptions. |
This section provides a quick view of how much revenue is waiting to be approved and posted.
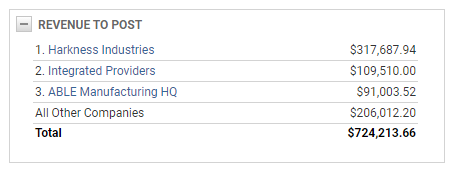
The list displays the total revenue awaiting approve and post for the following:
- Each of the three organizations with the highest amount of revenue awaiting approve and post.
The three organizations are listed in descending order by total amount awaiting approve and post. Click an organization name to access details.
- All Other Organizations, that is, all organizations other than the three listed separately.
- Total for all organizations, that is, the total amount of revenue awaiting approve and post.
The Resource Performance table provides a quick assessment of total billable hours worked by all resources, or a selected group of resources, during one week. The table lists each resource and displays the billable hours logged by that resource each day, followed by the resource's weekly total. In the table's last row, you can see the total for all resources for the week.
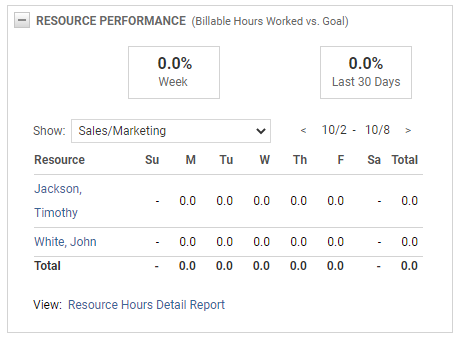
- The list displays the current week. Click the angle brackets ( < >) on either side of the date range to change the week.
TIP The First Day of Week is a location-level setting. An administrator can select Monday as the First Day of the Week for your location. Refer to Internal locations.
- Select an option from the Show menu to display all resources, or all resources in a selected department or workgroup.
The Show menu will remember your selection when you leave and return to the Executive Dashboard.
NOTE Resources hired mid-week are listed at the beginning of their first full week.
The % Week and % Last 30 Days fields show how the total hours worked by the resources in the list compare to the billable hours goals set for that group of resources.
TIP These fields are useful only if your Autotask administrator sets billable hours goals for the resources who enter billable hours on their timesheets.
NAVIGATION Set Billable Hours Goals for each resource in the Left Navigation Menu > Admin > Admin Categories > Organization Settings & Users > Resources/Users (HR) > Resources/Users (HR) > Resources > HR tab
Week
The percent of goal for the Week currently displayed is calculated as follows:
Total billable hours logged for the week by all listed resources divided by the total of weekly billable hours goals for all listed resources.
NOTE The weekly billable goals may be affected by the system setting “Reduce resource billable hours goal by reduction in available hours.” For details, refer to the link Reduce resource billable hours goal system setting, below.
Last 30 Days
The percent of goal for the Last 30 Days is for reference and based on the current day; it does not update when you change the display week. The percent is calculated as follows:
Total billable hours logged by all listed resources for the last 30 days, that is, yesterday and 29 days immediately prior to yesterday, divided by the total of daily billable hours goals for all listed resources for the last 30 days.
The daily Billable Hours Goal for each resource is calculated by splitting the Weekly Billable Hours Goal proportionally to the Daily Availability for each day of the week.
EXAMPLE For example: a resource's Weekly Billable Hours Goal is set to 16. The total of his Daily Availability for the week is 32 hours. 16 divided by 32 = 1/2. Therefore, for every 2 hours of available time, 1 hour should be billable. If the resource is available for 6 hours on one day, the Billable Hours Goal for that day is 3.
The total Billable Hours Goal figure for each day is calculated as the total of daily Billable Hours Goal amounts for all resources. The weekly total is the sum of daily totals.
NOTE The Weekly Billable Hours Goal and Daily Availability for each resource are both specified in the Left Navigation Menu > Admin > Admin Categories > Organization Settings & Users > Resources/Users (HR) > Resources/Users (HR) > Resources > HR tab. System Settings can also affect this calculation. Refer to Timesheets system settings.
The timesheet system setting “Reduce resource billable hours goal by reduction in available hours” can impact the values used to calculate the Weekly and Last 30 Days percentages.
- If this policy is turned off, the calculation is the total billable hours logged for all listed resources divided by the total of weekly billable hours goals for all listed resources.
- If the policy is turned on, any Paid Time Off hours are subtracted from the weekly or daily billable hours goals. Then the total billable hours logged for all resources in the list are divided by the total of billable hours goals for all resources in the list minus any Paid Time Off hours logged by the resources for the same time period. Paid Time Off hours are vacation, personal time, sick, holiday and floating holiday.
Refer to Timesheets system settings.
The Resource Hours Detail link above the Performance inset allows you to open the Autotask Resource Hours Detail report. The report displays ticket and project task information and is filtered on the currently selected week for all organizations, for all active resources, and content is grouped by resource. Once the report is opened, you can selectively filter data by resource, organization, time period, project type, task type, and project name.
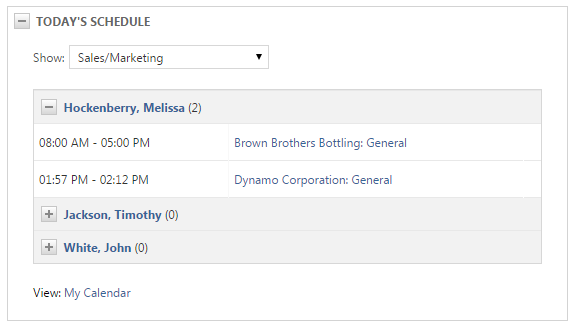
Today's Schedule lists all active resources or all active resources in a department or workgroup that you select from the Show menu. Click the My Calendar link to view your own schedule.
The Service Desk Summary provides a current count of the tickets in five critical categories including Due Today, Open Critical, Overdue, Completed in Last 2 Days, and New Client Portal Tickets.
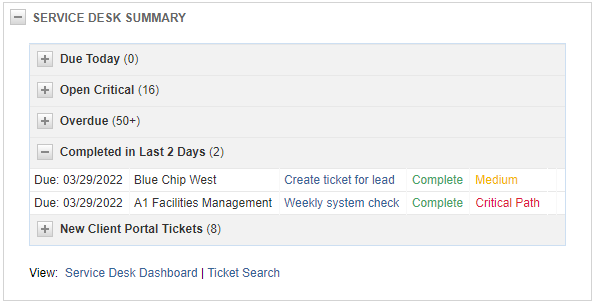
NOTE The lists are sorted by Due Date, oldest to newest. If any category contains over fifty items, the total count in the title bar displays (50+) and the list includes the first 50 items.
Click + next to a category to view a list of the tickets in that category. This list includes the due date, organization name, ticket title, status, and priority for each ticket.
Users with the necessary security privileges can click the ticket title to open the ticket. In addition, links to the Service Desk Dashboard and Ticket Search appear below the Ticket lists.
System Notices list critical events that require attention. The list can include up to six critical event types including Items Waiting Approval, Contracts Expired - Last 30 Days, Contracts Expiring - Next 30 Days, Warranties Expired - Last 30 Days, Warranties Expiring - Next 90 Days, Overdue Department To-Dos.
NOTE The lists are sorted by Expiration Date, oldest to newest, where applicable (for example, Warranties Expiring), or by period end date (for example, for timesheet or expense report approval). If any category contains over fifty items, the total count in the title bar displays (50+) and the list includes the first 50 items.
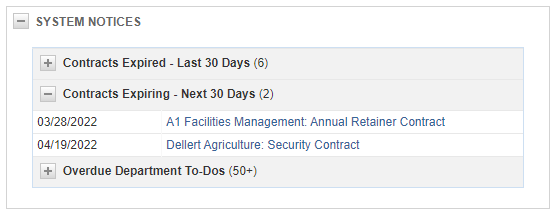
Users with the necessary security permissions can click listed items to access details.
CRM Summary displays a count of current Opportunities in each of three categories: Open Opportunities, Closed Opportunities this Month, and Lost Opportunities this Month. A category appears in the list only when there are opportunities from that category to display.
NOTE The lists are sorted by Create Date, oldest to newest. If any category contains over fifty items, the total count in the title bar displays (50+) and the list includes the first 50 items.
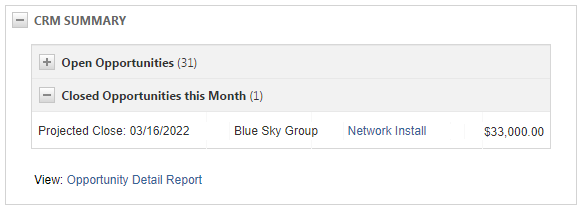
Users with the necessary security privileges can click listed Opportunities to access details. In addition, a link to the Opportunity Detail Report appears below the Opportunity lists.
Projects Summary displays a count of the Projects in each of five categories: Projects Due this Month, Projects Completed this Month, New Projects, Open Projects with Overdue Tasks, Open Projects Exceeding Estimated Hours.
NOTE The lists are sorted by Create Date, oldest to newest. If any category contains over fifty items, the total count in the title bar displays (50+) and the list includes the first 50 items.
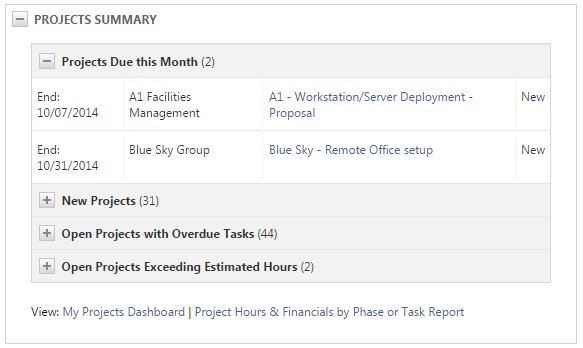
Users with the necessary security privileges can select a link to view the details of the listed project.
In addition, for users with access to the Projects module, two additional links appear below the Project category titles: My Projects Dashboard and the Project Hours & Financials by Phase or Task Report.
TIP For an overview of the definitions and calculations underlying the Executive Dashboard, refer to Definitions and Calculations.


