Profitability by month
PERMISSIONS Security level with access to Contracts, and account managers and account team members if Allow Account Managers and Account Team Members to access Organization Detail > Financials and the Executive Summary Report for their organizations is enabled.
NAVIGATION Left Navigation Menu > CRM > Search > Organizations > click on an organization name > accessory tabs > Financials > click on the report name
About the Financials: Profitability by Month report
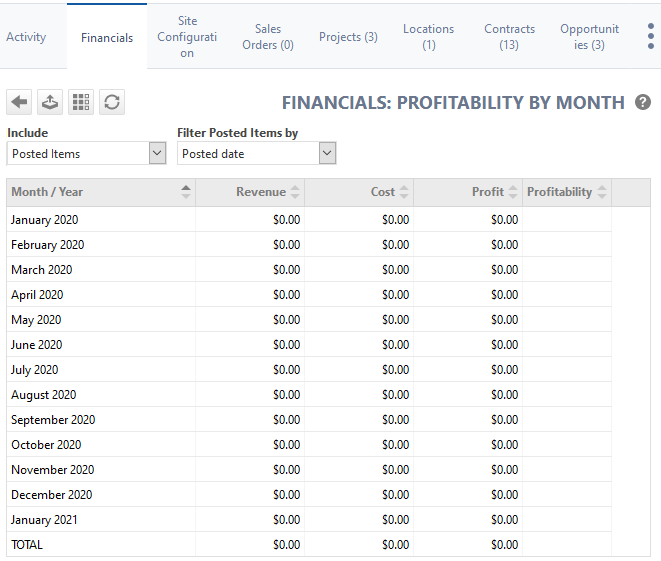
The Profitability by Month table displays the revenue, cost, profit and profitability for the organization over the past 12 months, not including the current month. It is intended to show a historical trend for these financial metrics. To open the page, use the path(s) in the Security and navigation section above.
For an overview of what is included, refer to Revenue and cost items included at the organization, contract, and project level.
| Option | Description |
|---|---|
|
|
Click the back button to return to the previous page. |
|
|
PERMISSIONS By default, Export is available to users with Admin security level and disabled for all others. It can be enabled for other security levels. Refer to Can export Grid Data. NOTE When exporting to CSV: To ensure consistent date/time formatting in the CSV output, we strongly recommend that the user’s date/time format settings in Autotask be identical to the Windows date/time format settings of the computer performing the export. This will prevent conflicts in how the software that generates the report interprets the date/time format.
NOTE Note that only the selected columns of the first 5,000 records will be exported. IMPORTANT The export file does not contain all fields that are required to re-import the data using the data import templates, and the data headers do not match. |
|
|
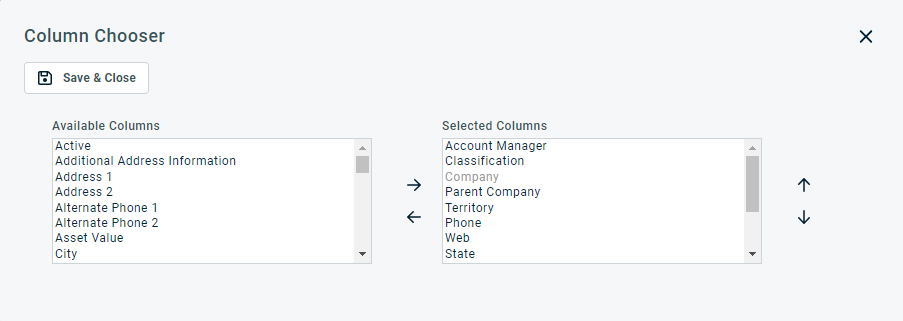
The Column Chooser allows you to customize search results tables throughout Autotask. It determines the following:
NOTE Column Chooser settings on search results tables and some standard reports are part of the user settings stored on the Autotask server. You can log in from any computer and have your column chooser settings applied to your Autotask session. To clear the data stored in your Autotask instance and reset the column chooser settings to the Autotask default settings, click Reset Settings in My > Miscellaneous > Settings. To customize the table, do the following:
Columns appear either in the Available Columns or the Selected Columns panel.
NOTE Top-to-bottom order in the Selected Columns list becomes left-to-right order on the Search Results list.
TIP If the characters + # appear after the column name, then that column may have multiple items returned for some rows. If that occurs, the first item will appear in the row followed by + and the number of additional items returned. To display the list of additional items, hover over the item in the column. |
|
|
Click the refresh icon |
The table header contains the following filters:
| Name | Description |
|---|---|
| Include | Select pending, posted or pending and posted items. |
| Filter posted items by | Select either the Posted date (default) or the Item date as the reference date for the time frame columns |
| Column | Description |
|---|---|
| Month / Year | The previous 12 months, not including the current month. For example, if the current month is April 2023, the table will contain data from April 2022 through March 2023. |
| Revenue | The Revenue metric sums all revenue for the organization for the past 12 months. |
| Cost | The Cost metric sums all cost for the organization for the past 12 months. |
| Profit | The Profit metric allows you to compare historical profit across the past 12 months. |
| Profitability | The Profitability metric allows you to compare historical profitability across the past 12 months. |
The table displays a row for each of the past 12 months, plus the current month. This time frame cannot be changed.
Comparison of Financials reports to standard reports
Because the data set of Financials, the Executive Dashboard and the Profit (Organization, Contract, Project) LiveReports family are more inclusive than standard reports, the totals for those tables and reports will not necessarily match standard reports. Refer to:


