System dashboards
A dashboard interface condenses and aggregates real time information and displays it in one place. It presents information in simple to read charts and tables. Dashboards help you to quickly assess the current state of activity so you can plan accordingly.
Autotask offers two types of dashboards:
- Custom dashboard tabs that you can arrange, modify, and even build yourself. Refer to Introduction to the Autotask dashboard.
- The standard system dashboards described in this topic.
TIP You can set a dashboard as your home page in your user profile. Refer to Settings.
Standard dashboards
Standard dashboards collect and display diverse data in a preset selection of tables and charts. You cannot add, remove, or arrange the charts or tables. An administrator can configure some settings on the standard dashboards, but those settings apply to all dashboards of the same type. You cannot customize a standard dashboard for your personal use.
There are three standard dashboards, each related to a specific workflow:
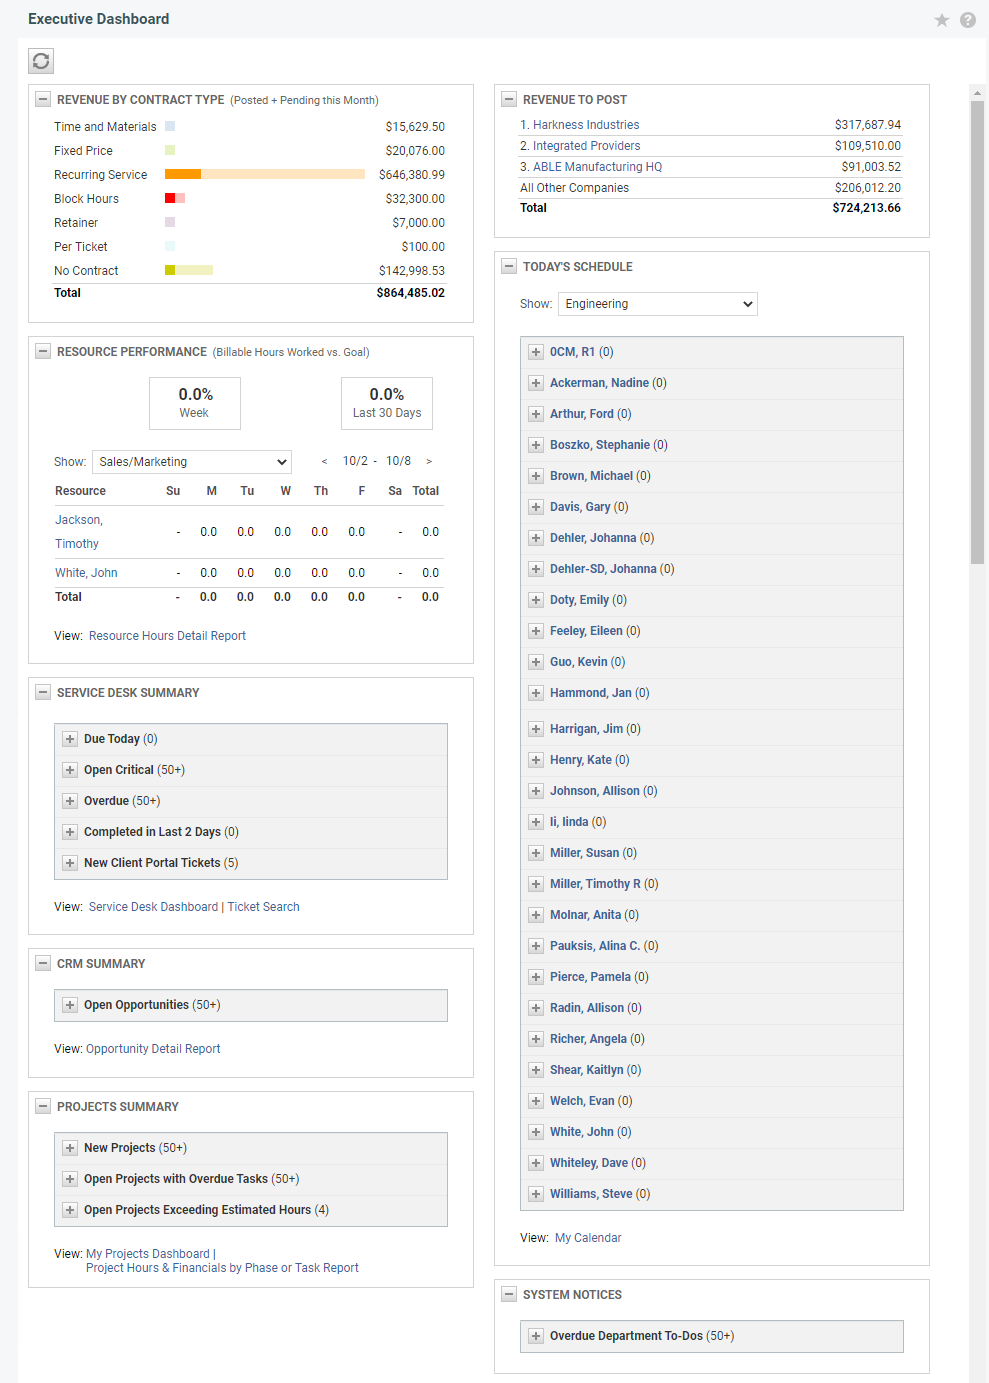
- Executive Dashboard: Located in the Home module, this dashboard displays a summary view of key indicators related to current business activity tracked in Autotask. To access this dashboard, you must have access to at least one of the following modules: Admin, Contracts, or Reports. Refer to The Executive dashboard .
- Projects Dashboard: This dashboard displays data from multiple projects associated with multiple customers, personnel resources and deadlines. Designed for project managers, it is available to all users with access to the Projects module. Refer to The Projects dashboard.
- Service Desk Dashboard: Displays a summary view of Service Desk metrics for all active tickets. Available to all users with Ticket View permission = All, it is particularly useful to Service Desk Managers. Refer to The Service Desk dashboard.


